One of the main disadvantages of dynamic positioning systems when compared to mooring systems, is the fuel costs incurred in operation. But it is necessary to quantify that difference in order to make an informed choice between the two possibilities: mooring or dynamic positioning.
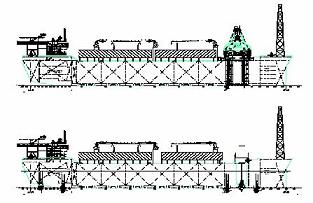
In Ref [1], a comparison of fuel consumption between a passively moored FPSO and a Dynamic Positioned FPSO is made. The arrangement of the two versions are show in pictures on the right. The moored version of the FPSO has an internal turret with 3*3 chain mooring arrangement. The DP version of the FPSO has a thruster layout consisting on 7 thruster units.
The following simulations were carried out:
- DP station keeping simulations.
- Power use and fuel consumption simulations.
The analysis considers a typical annual scatter diagram of sea states for the Gulf of Mexico. The results are summarized in the table below:
| Option | HFO consumption t/year | HFO Cost €m | |
| DP FPSO | Annual Average consumption | 6,930.7 | 1.7 |
| Moored FPSO (DP system out) | Annual Average consumption of ship systems = 2.5 MW | 6,428.4 | 1.6 |
| Diference = 0.1 | |||
| MDO equiv. t/year | |||
| Process Plant | Gas Turbines 2*25MW 30 MW load | 24,737.2 |
Resume and analysis:
- The results show that the DP FPSO concept requires about 7% extra fuel compared to the moored FPSO concept (total for the ship), while it is 1.5% if the power of the “process plant” for production is also considered.
- If we consider the “process plant” consumption as equivalent to the “seastead consumer plant” (a very gross consideration for all lighting, HVAC,…) the expected difference between the two options is only that 1,5%, which is very small and put the balance on the side of DP system.
- If the metocean conditions are worst than in Gulf of Mexico, the DP system would consume more, and the 1,5% extra fuel in difference would be higher. But it is not expected to est ablish a seastead in a rougher scenario than the GoM.
- The net difference in the annual fuel consumption cost is only 0.1 €m between the DP and moored versions. Therefore, the annual consumption of the DP system is 100,000 € which implies:
- DP fuel cost per year = 100,000 €
- DP fuel cost per month = 8,333
If we do a gross estimation of the potential number of “seastead apartments” available on the FPSO, we obtain following results:
Length = 262.4 m
Beam = 46 m
Main Deck space = 10,863 m2
Number of decks = 5.00
Total deck space = 54,317 m2
Average space apartment = 100 m2
No. Apartments = 543
=> DP fuel cost per month and apartment = 15 €
That means that the cost per “seastead apartment” is quite low and shows that a DP system need not have high operating costs, for a big vessel such as this, with a somewhat hydrodynamic shape.
Notes and Conclusions
- Bunker fuel is used for power generation, as opposed to diesel, which is used in the calculations of the ClubStead report. Diesel tends to be a lot more expensive. However, if for some reason diesel were to be considered more desirable, costs would still remain modest.
- This analysis only considers OPEX and not to CAPEX; differences in installation costs between a mooring and DP system are not taken into account. For shallow waters, mooring would probably have a CAPEX advantage, but for deep waters, DP would probably be preferrable for CAPEX reasons as well.
- We can conclude that for a large barge like seastead, a DP systems has only modest operating costs, as compared to the total operating costs of the seastead.
[1] Aalbers, Albert B.; de Vries, Leo; van Vugt, Hans. Fuel consumption and emission predictions: application to a DP–FPSO concept. Houston: Dynamic Positioning Conference, October 2006.